Cluster detection, analysis and visualization
Author: Aaron Brooks / @scalefreegan
You can follow along on ![]()
http://scalefreegan.github.io/Teaching/DataIntegration
Goals: Cluster Detection
- How to measure similarity: distance measures
- Node-based clustering
- Spectral clustering
- Edge-based clustering
- Link-community detection
Clustering in a nutshell
Some way to group elements that are more similar to each other than they are to everything else
What does it mean to be more similar? Need to define a metric
What is a metric?
A nonnegative function g(x,y) describing the "distance" between neighboring points for a given set
$g(x,y) \ge 0$
$g(x,y) = g(y,x)$
$g(x,y) = 0 \quad iff.\ x = y$
$g(x,y) + g(y,z) \ge g(x,z)$
Similarity metrics can express a broad range of relationships
- Spatial ($\ell_1$ or $\ell_2$ norm)
- Information (Hamming distance)
- Inner product space (Cosine similarity)
- Kernel function (RBF)
Getting started with clustering
k-means
How?
Minimize $\sum_{k=1}^K \sum_{x_n \in C_k} ||x_n - \mu_k||^2$ with respect to $C_k$ and $\mu_k$
Lloyd's algorithm: two steps
Given $k$ and inital cluster centers, $\mu_k$
- Assign points to closest centroid
- Recalculate $\mu_k$
Repeat (1) and (2) until $\sum_{k = 1}^K|\mu_{k_{t+1}} - \mu_{k_{t}}| \le \epsilon$
More detail at The Data Science Lab
Clustering Nodes
Advanced Clustering
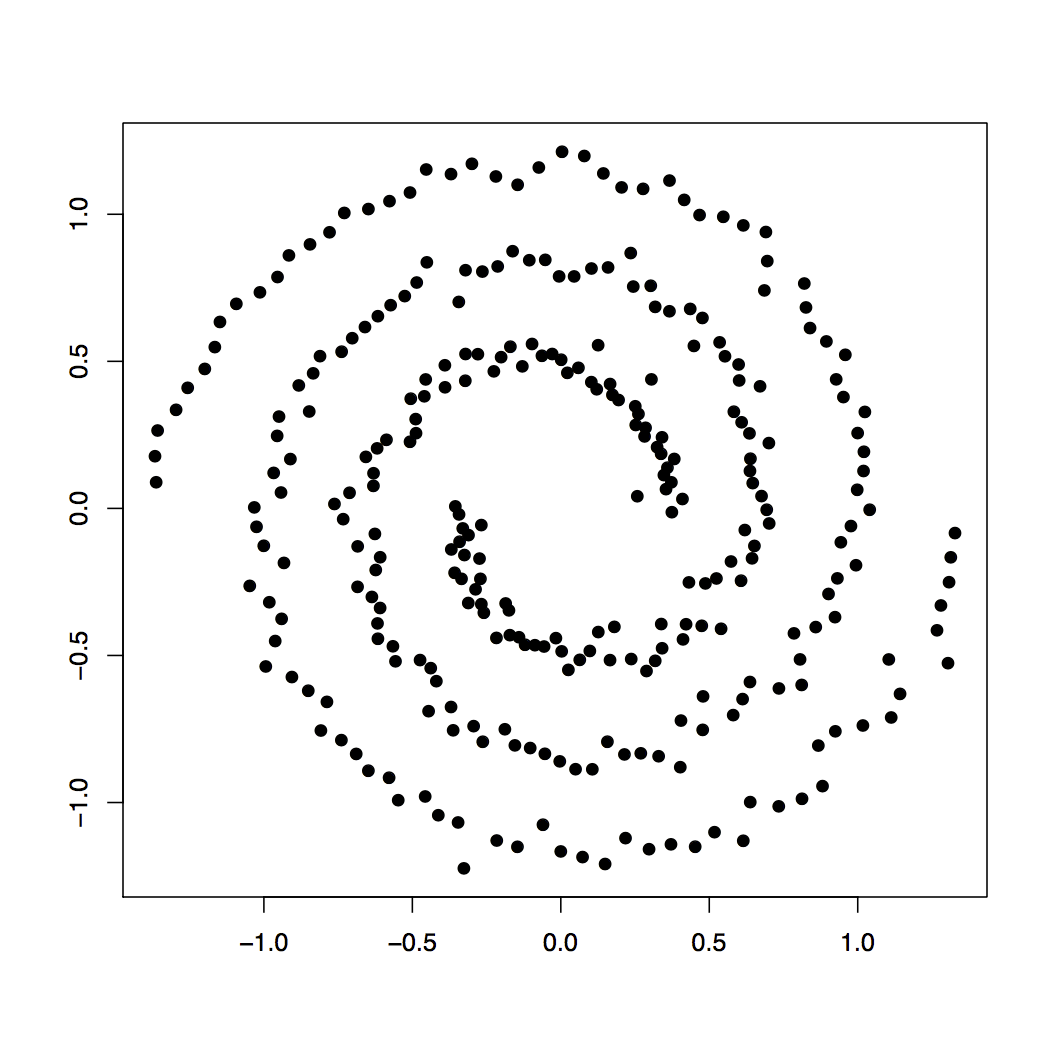
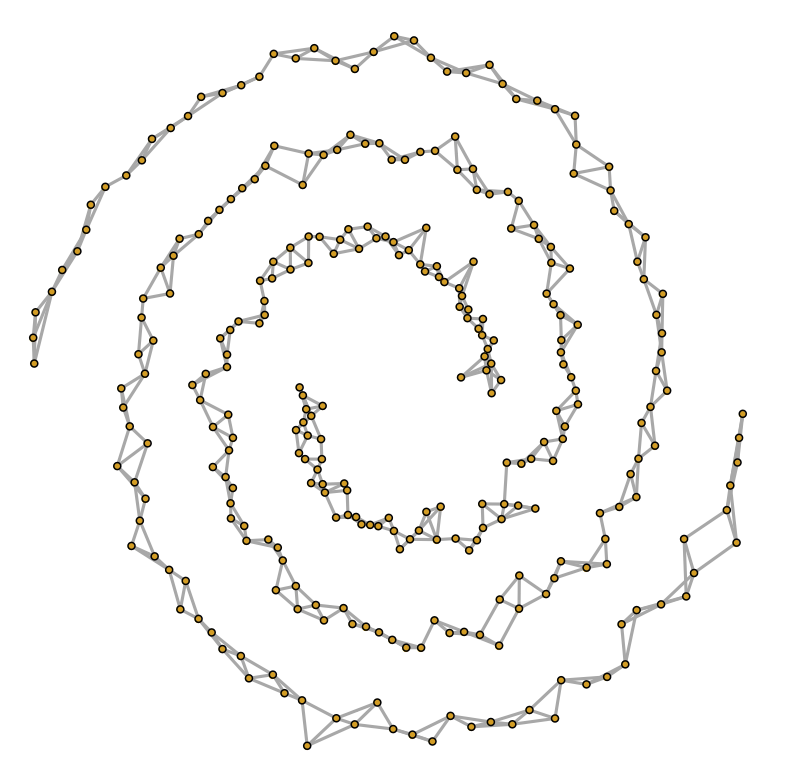
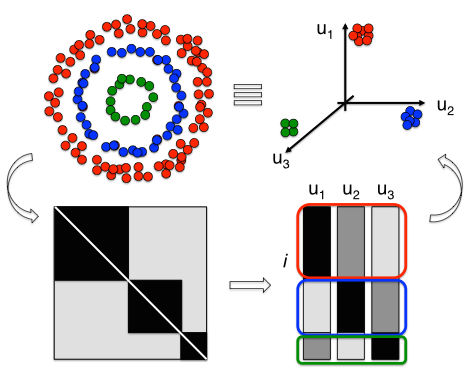
What if your data looks like this?
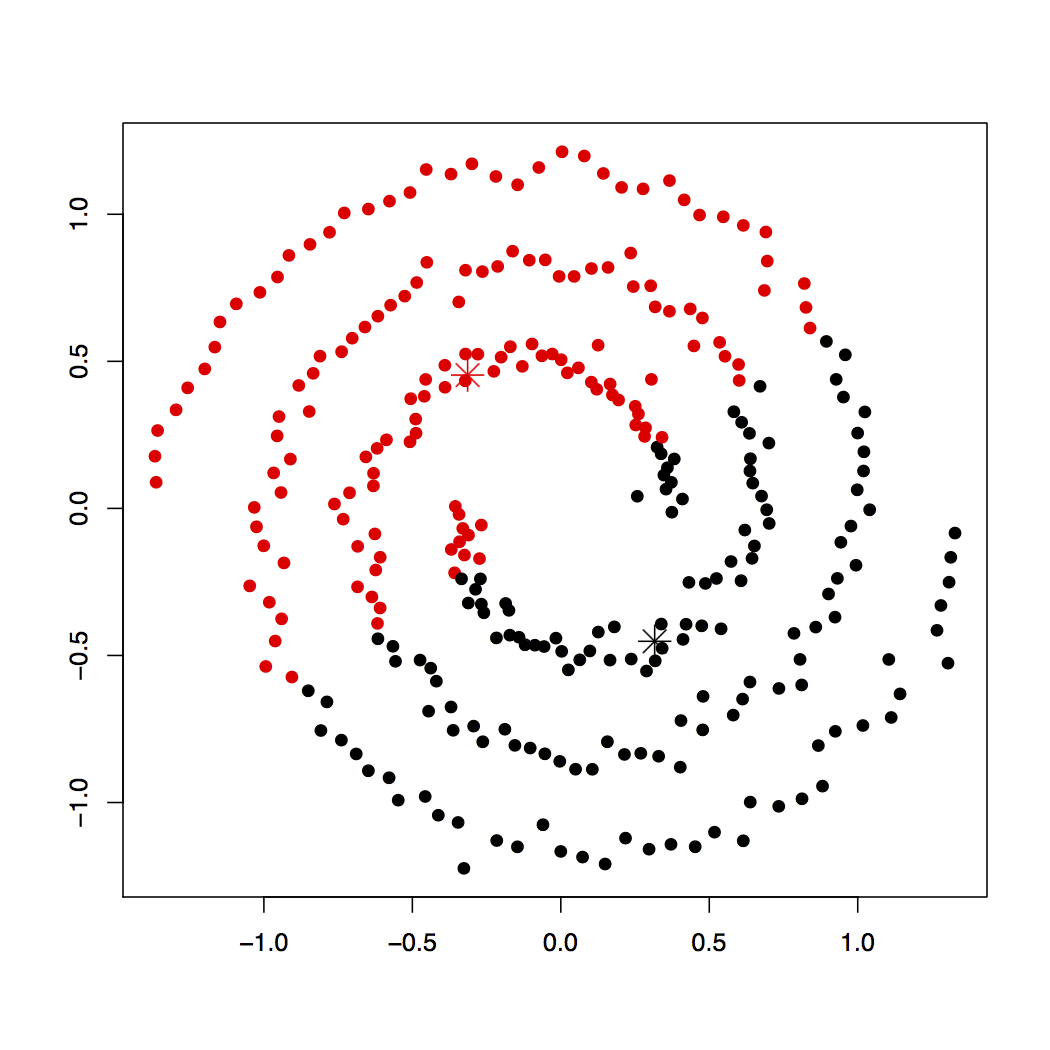
K-means Solution
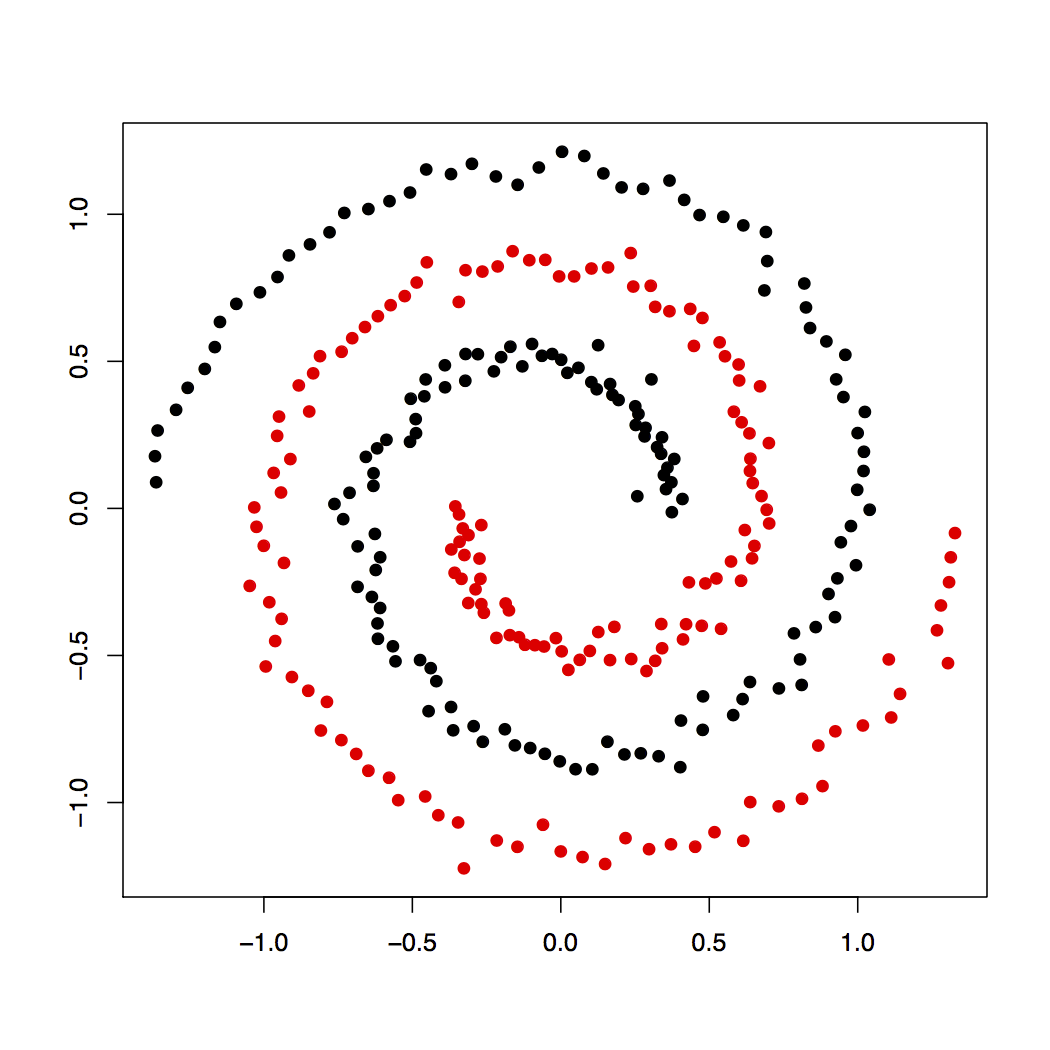
Spectral Clustering Solution
Spectral Clustering
Some advantages
- Can be solved efficiently by standard linear algebra software
- Often outperforms traditional clustering algorithms such as the k-means algorithm
Luxburg (2007). A Tutorial on Spectral Clustering
Spectral Clustering: Steps
- Compute the similarity matrix, S (e.g. Kernel function)
- Calculate the affinity matrix, A, from S (e.g. k-nearest neighbors algorithm)
- Calculate a graph Laplacian, L
- Perform k-means clustering on matrix, Z, consisting of eigenvectors for k smallest eigenvalues, ignoring the smallest (constant) eigenvector of L
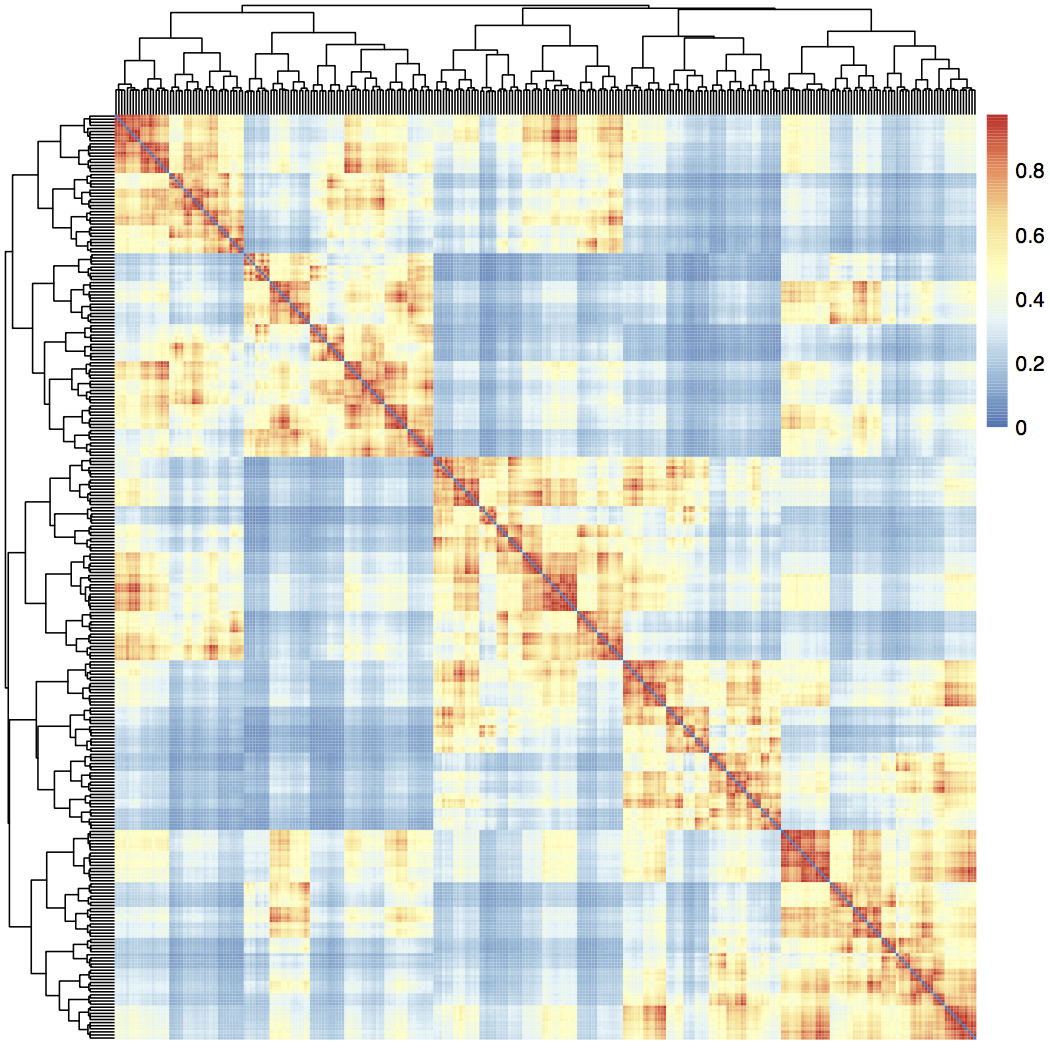
Data ⇨ Transform and Embed
1. Compute the similarity matrix, S (e.g. Kernel function like RBF)
2. Calculate the affinity matrix, A, from S (e.g. k-nearest neighbors algorithm)
3. Calculate a graph Laplacian, L
$L = D − W$
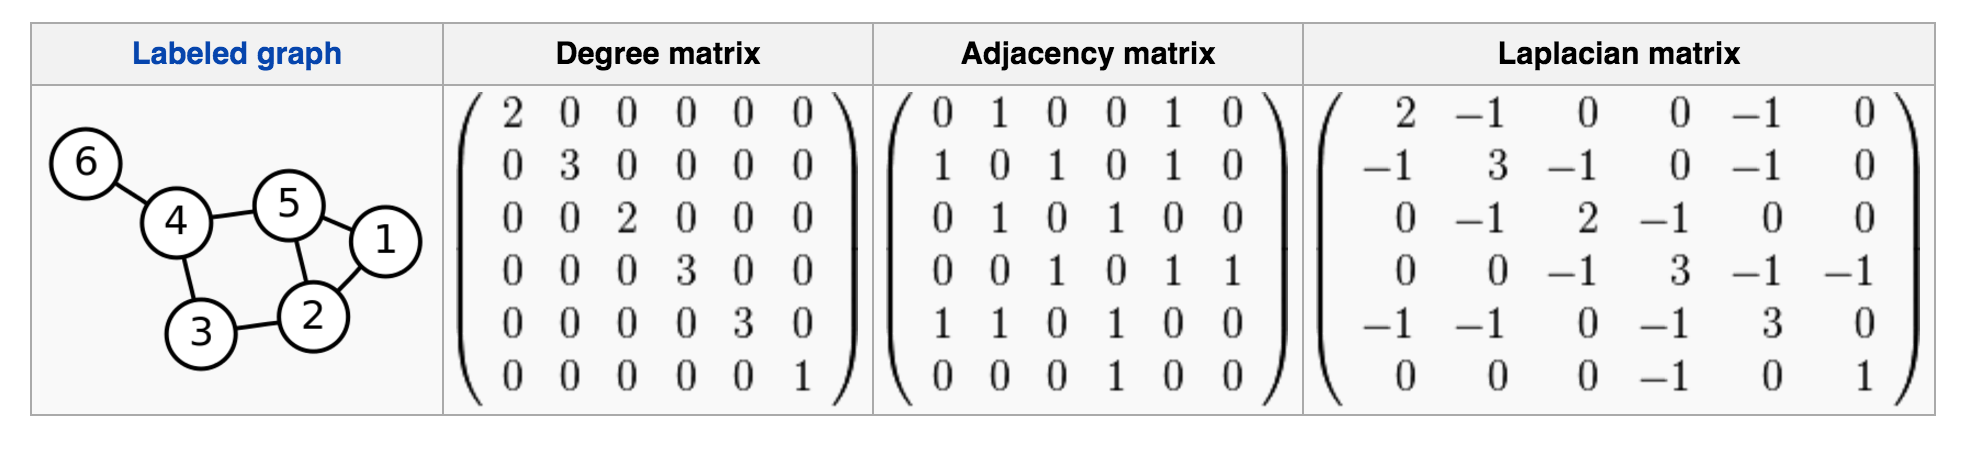
Wikipedia: Laplacian matrix
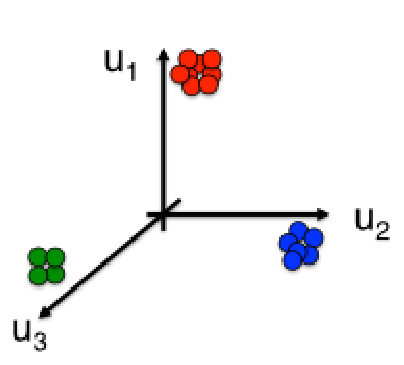
4. Perform k-means clustering on matrix, Z, consisting of eigenvectors for k smallest eigenvalues of L
Aside: Can also be formulated as Mincut
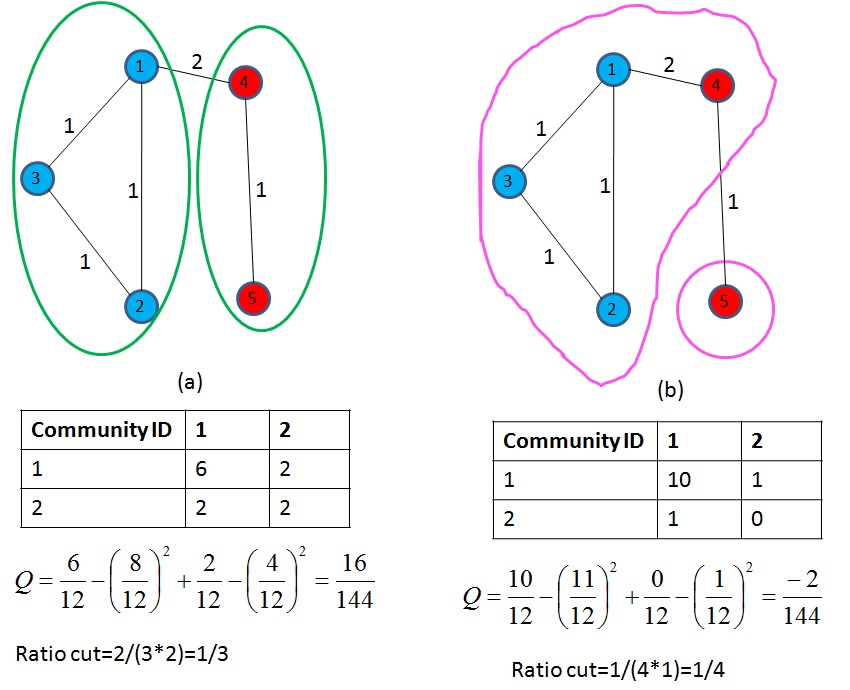
Mincut
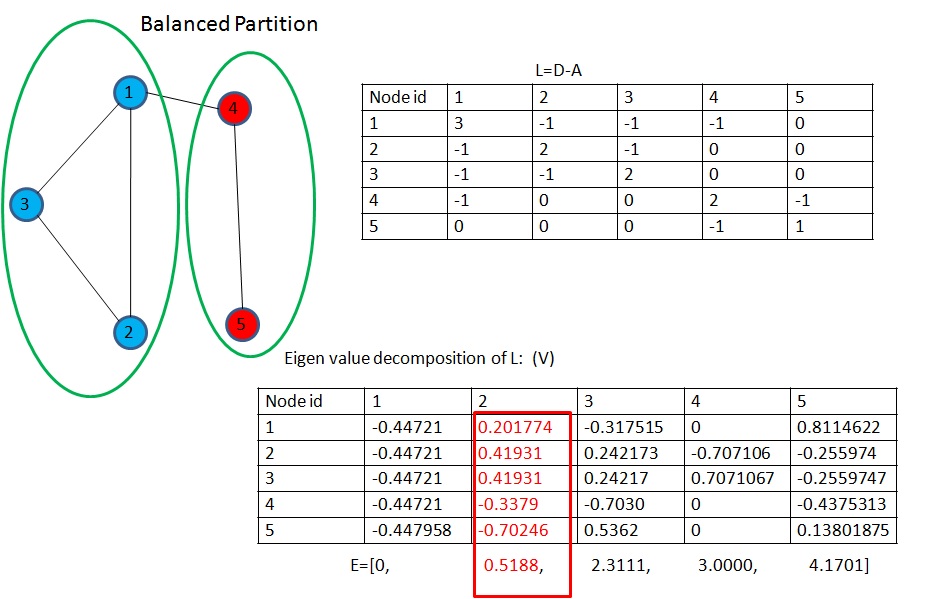
Eigen value decomposition ⇨ Fiedler vector
Overview for $k>2$
Clustering Edges
Link-community clustering
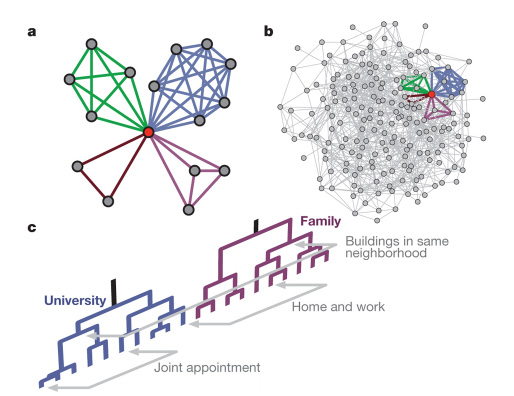
Yong-Yeol et al (2010). Link communities reveal multiscale complexity in networks
Cluster edges rather than nodes
Yong-Yeol et al (2010). Link communities reveal multiscale complexity in networks
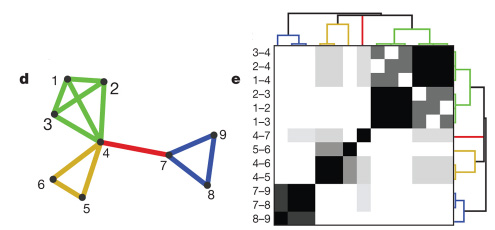
Link-community clustering: Steps
- Compute similarity score between every pair of edges
- Perform agglomerative clustering on edge similarities
- Cut dendrogram at height that maximizes cluster density
1. Compute similarity score between every pair of edges
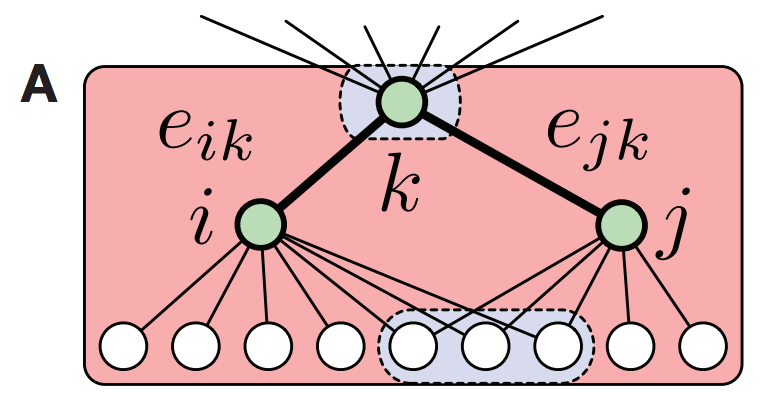
Yong-Yeol et al (2010). Link communities reveal multiscale complexity in networks
2. Perform agglomerative clustering on edge similarities
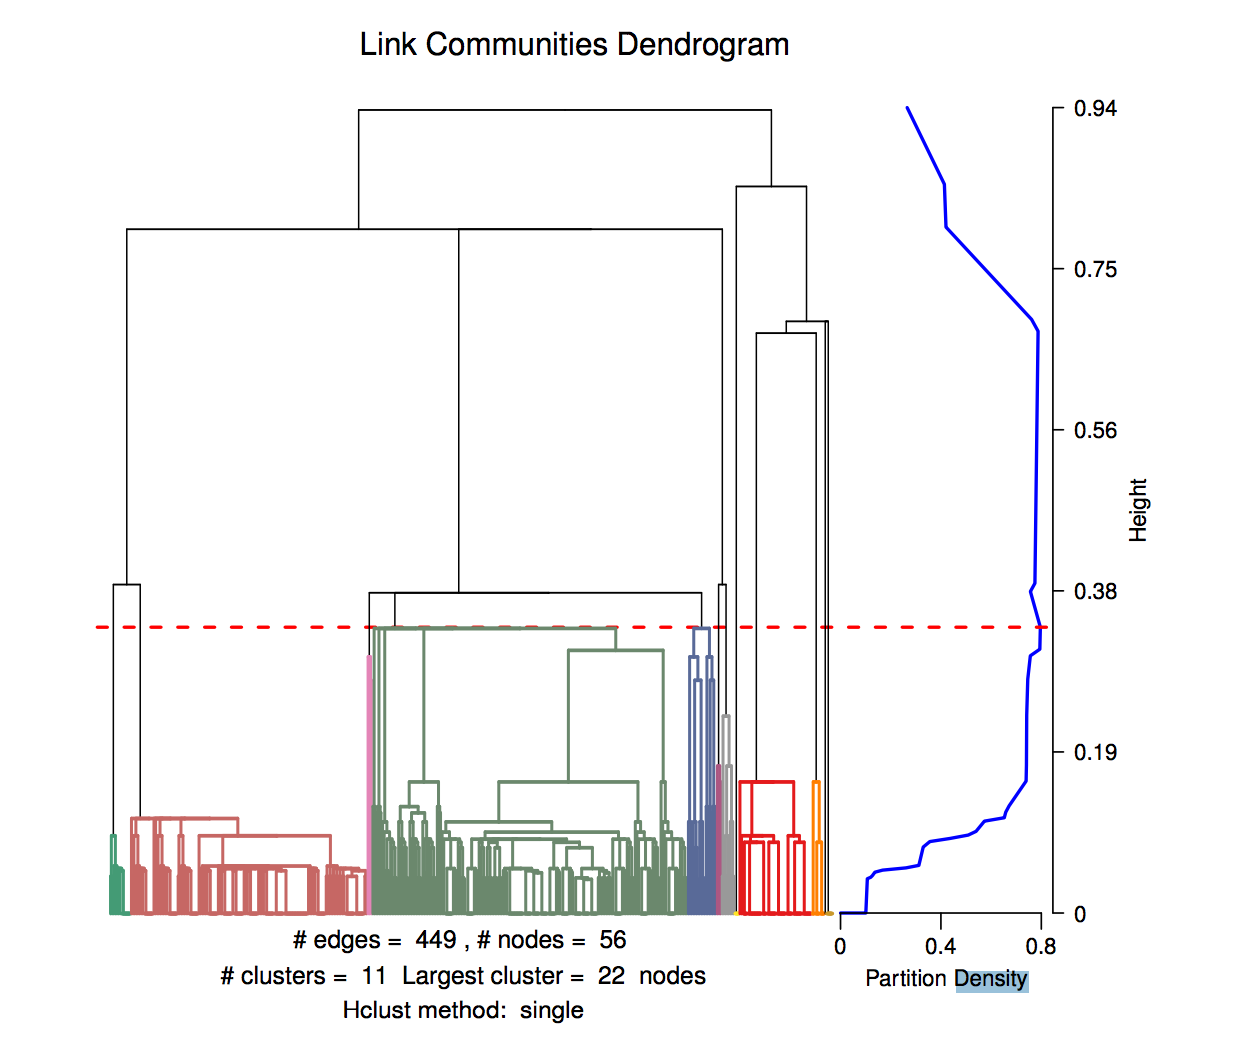
Yong-Yeol et al (2010). Link communities reveal multiscale complexity in networks
3. Cut dendrogram at height that maximizes cluster density
Yong-Yeol et al (2010). Link communities reveal multiscale complexity in networks
Resulting link communities are multiscale...
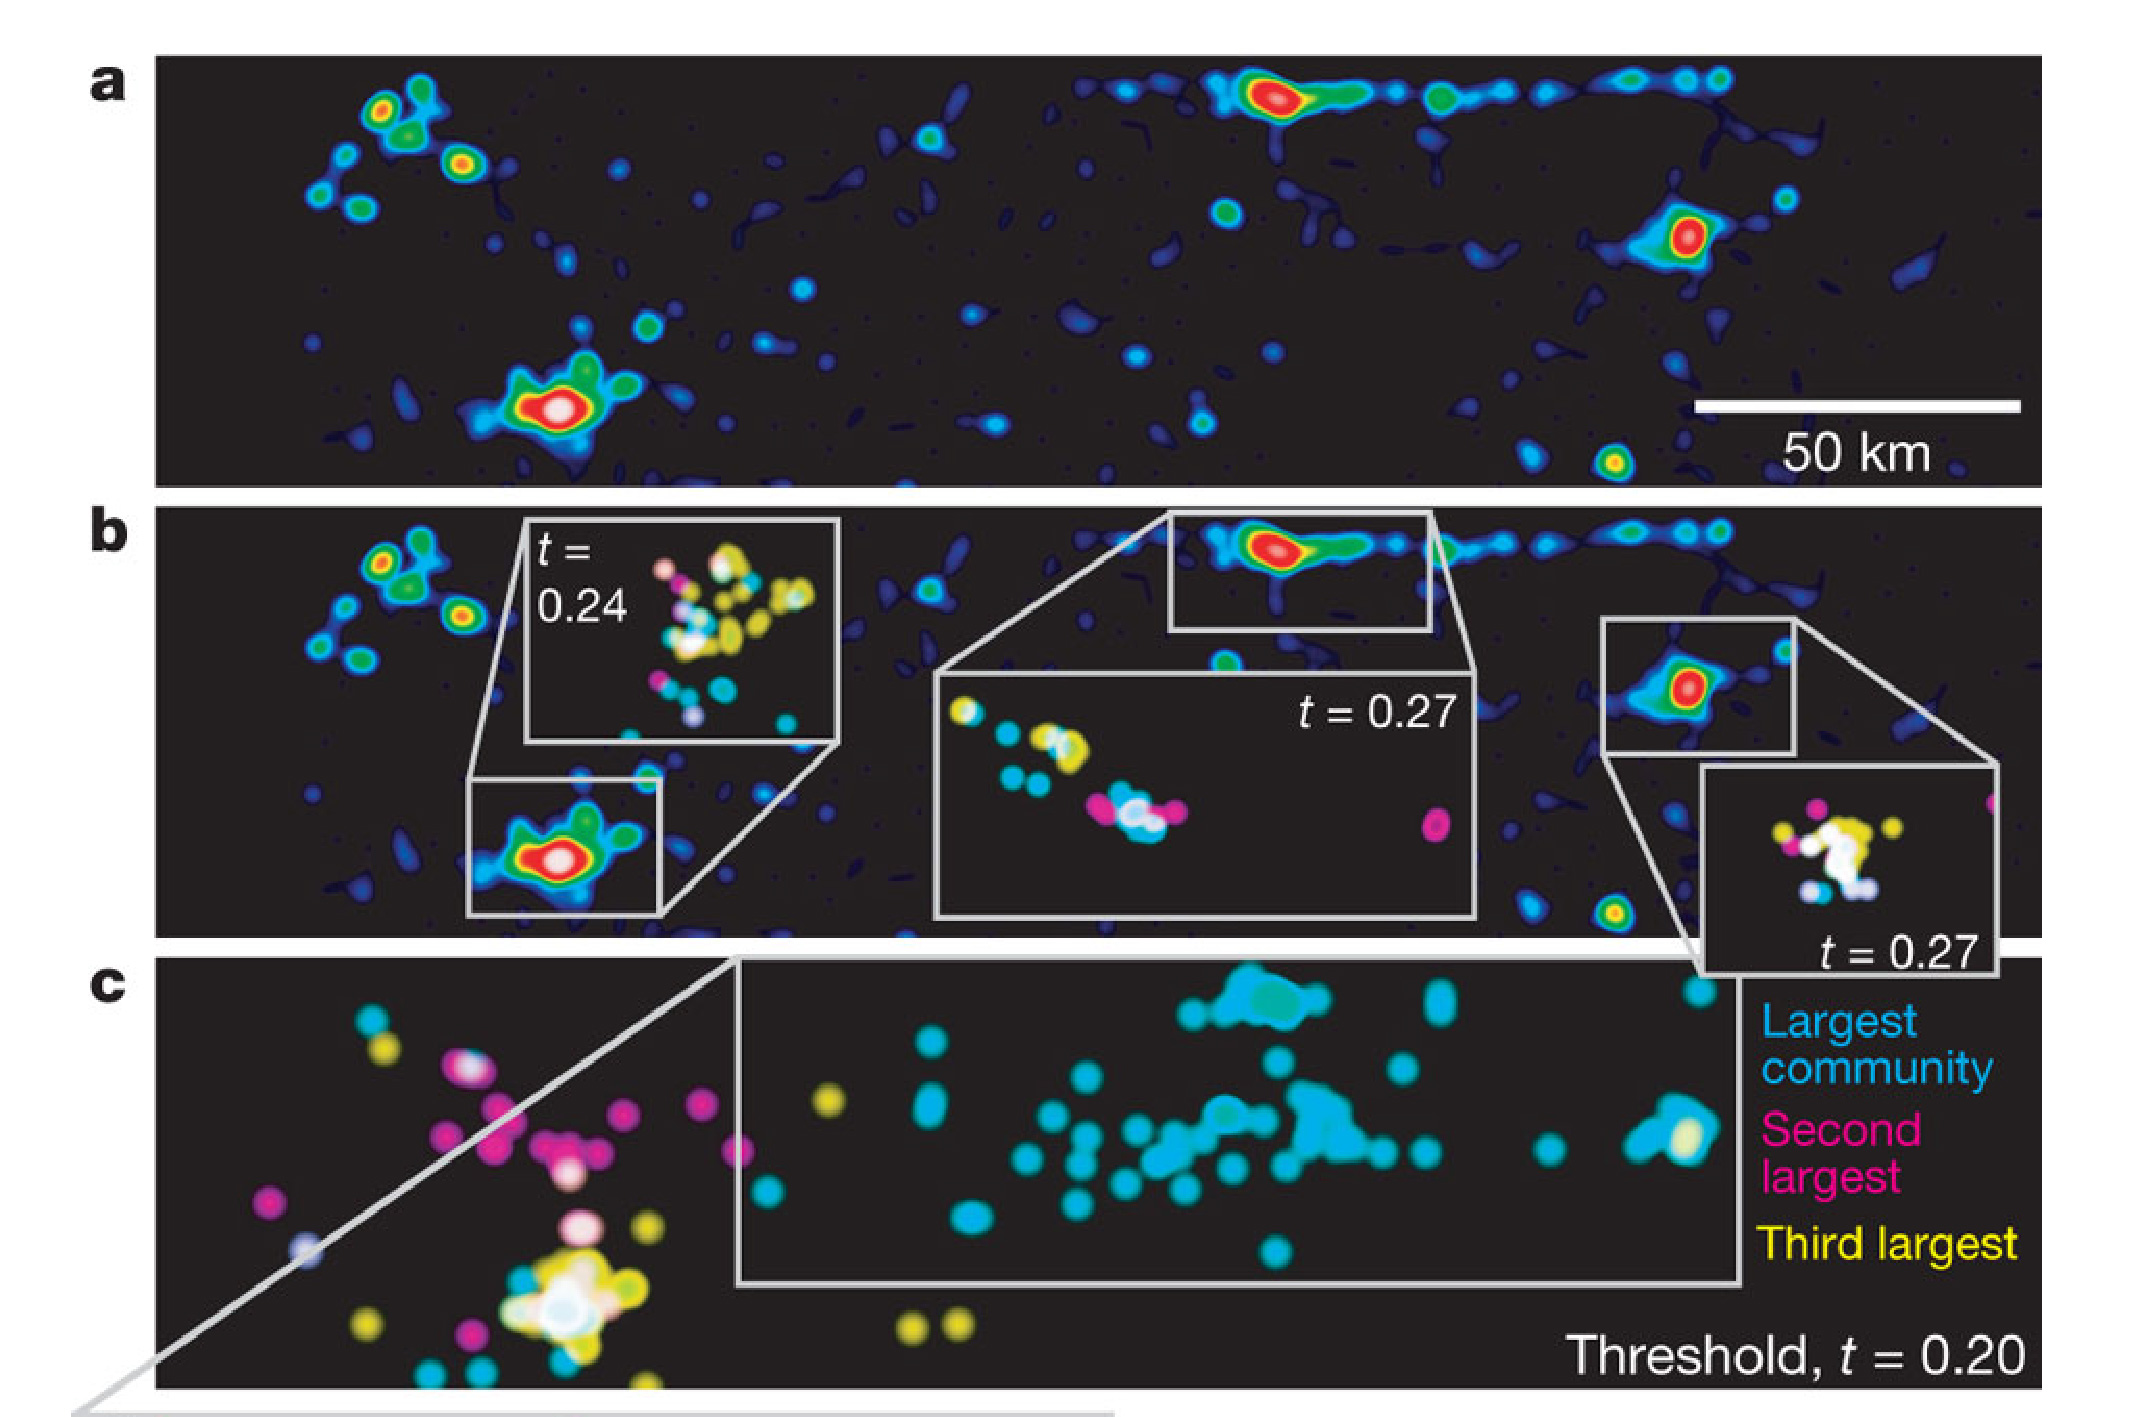
Yong-Yeol et al (2010). Link communities reveal multiscale complexity in networks
Resulting link communities are multiscale...
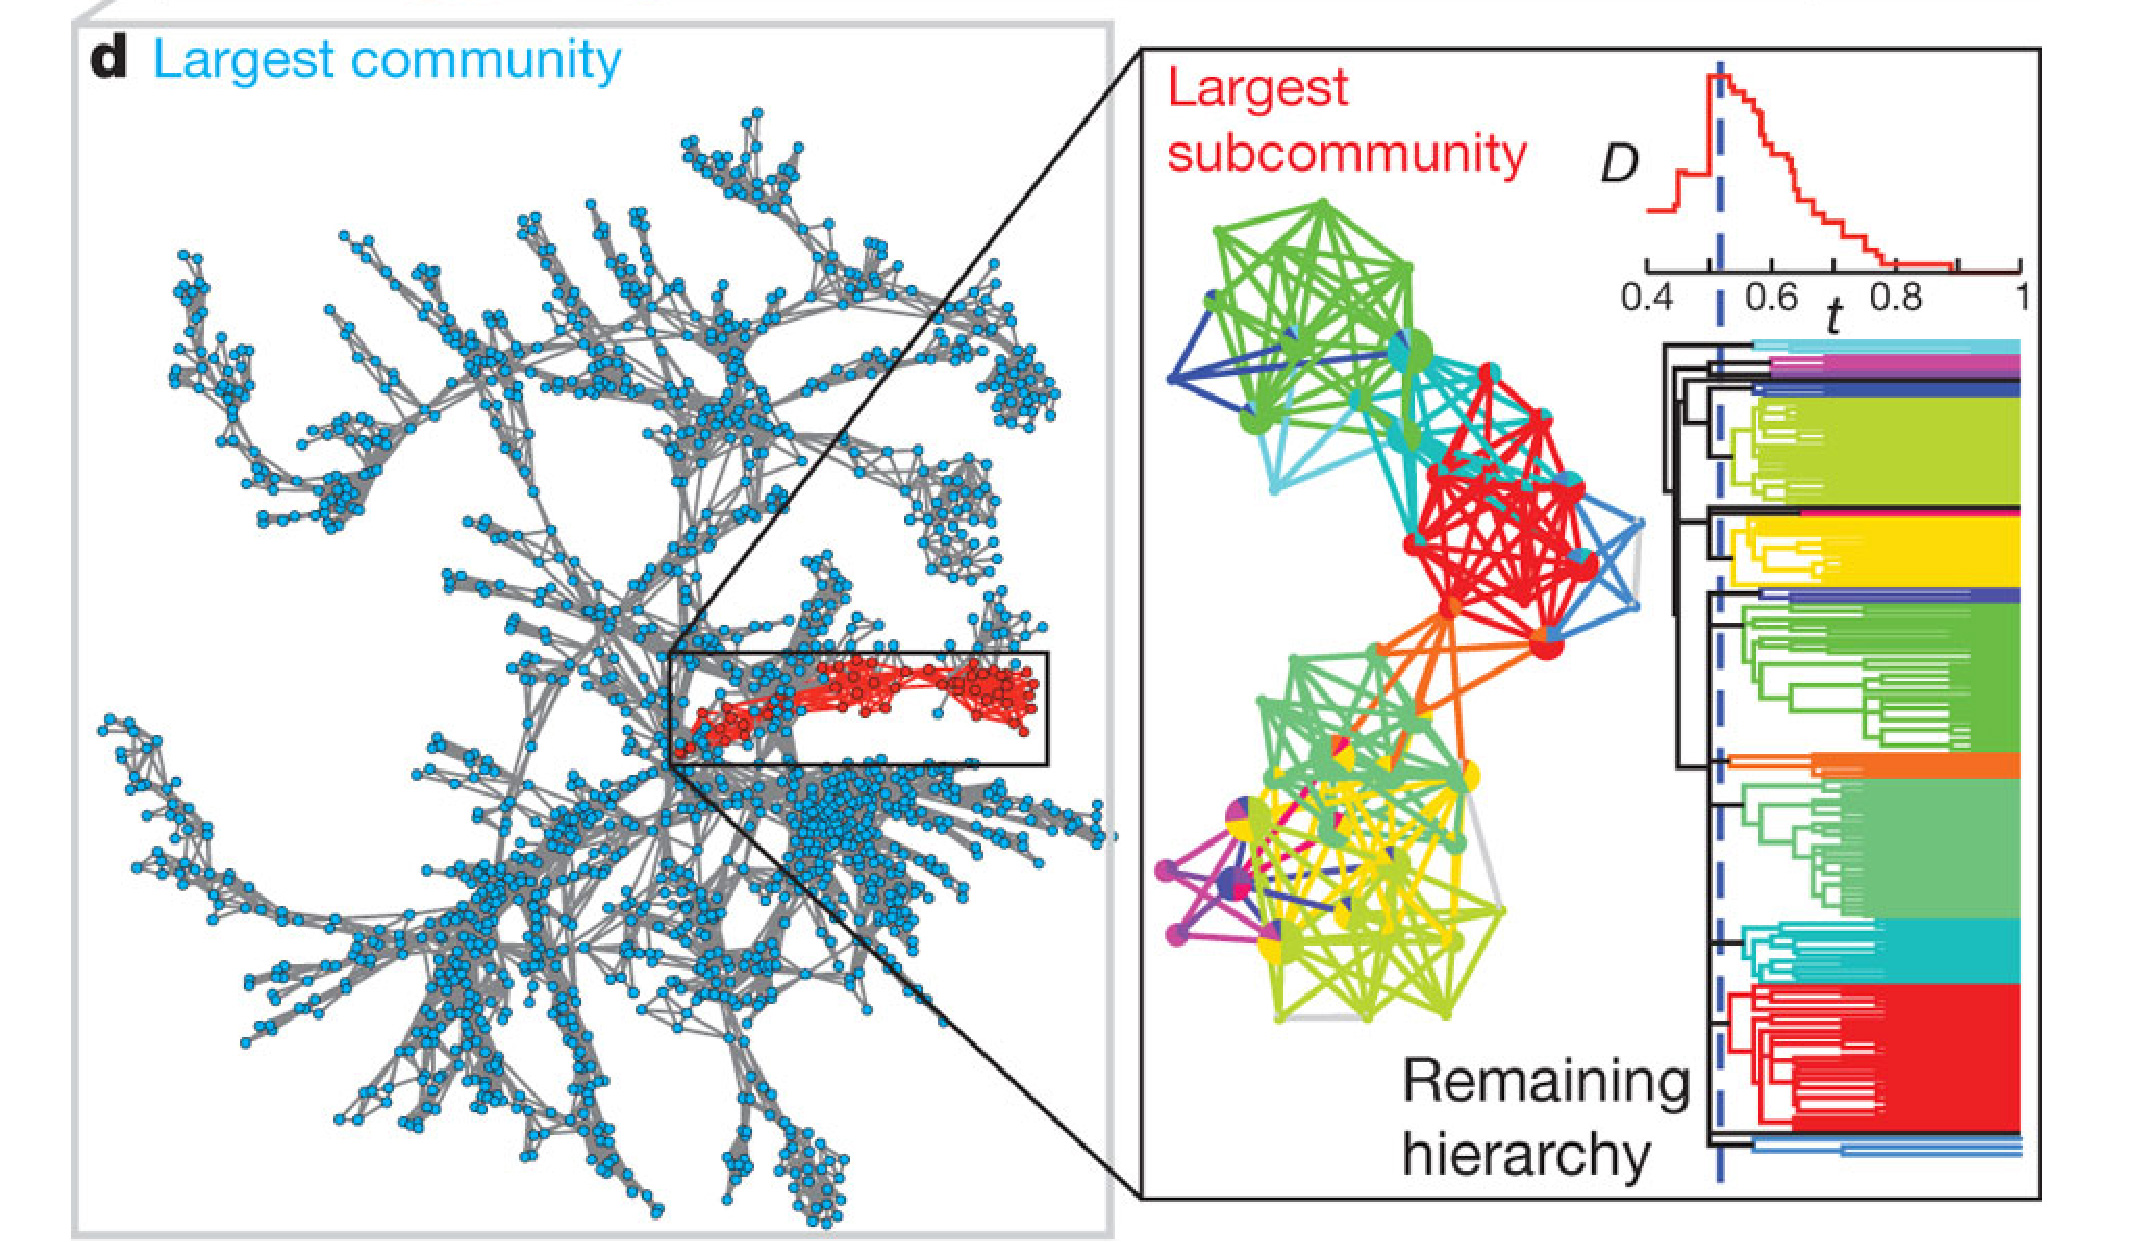
Yong-Yeol et al (2010). Link communities reveal multiscale complexity in networks
...and overlapping
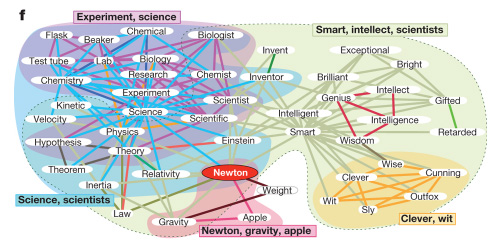
Yong-Yeol et al (2010). Link communities reveal multiscale complexity in networks
Examples
Flavor Network
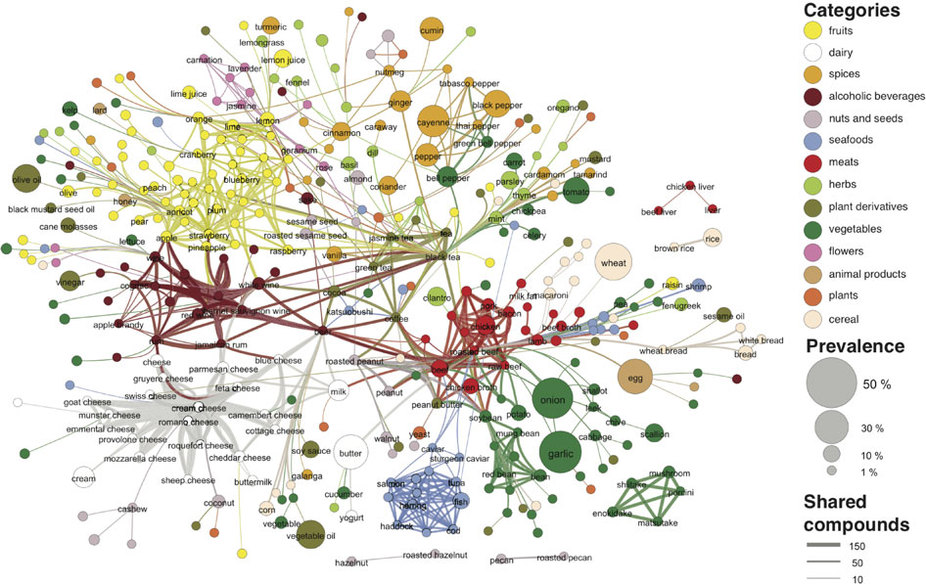
Yong-Yeol et al (2011). Flavor network and the principles of food pairing
EGRIN2.0
Gene co-regulation network
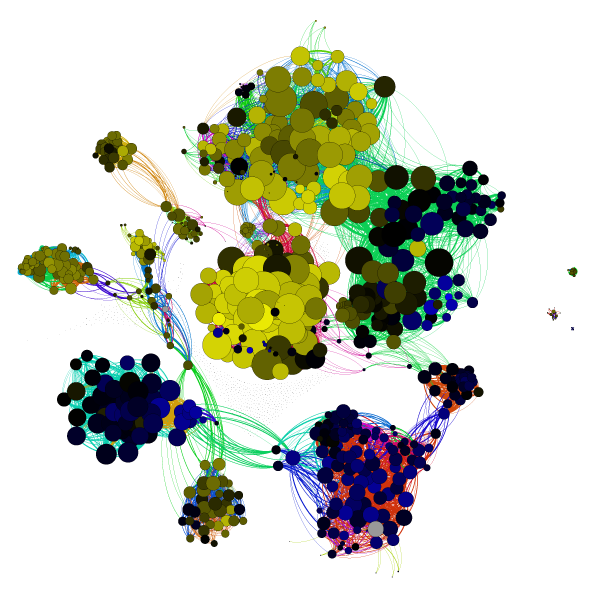
Brooks and Reiss et al (2014). A system‐level model for the microbial regulatory genome
Conditionally Co-regulated Modules (Corems)
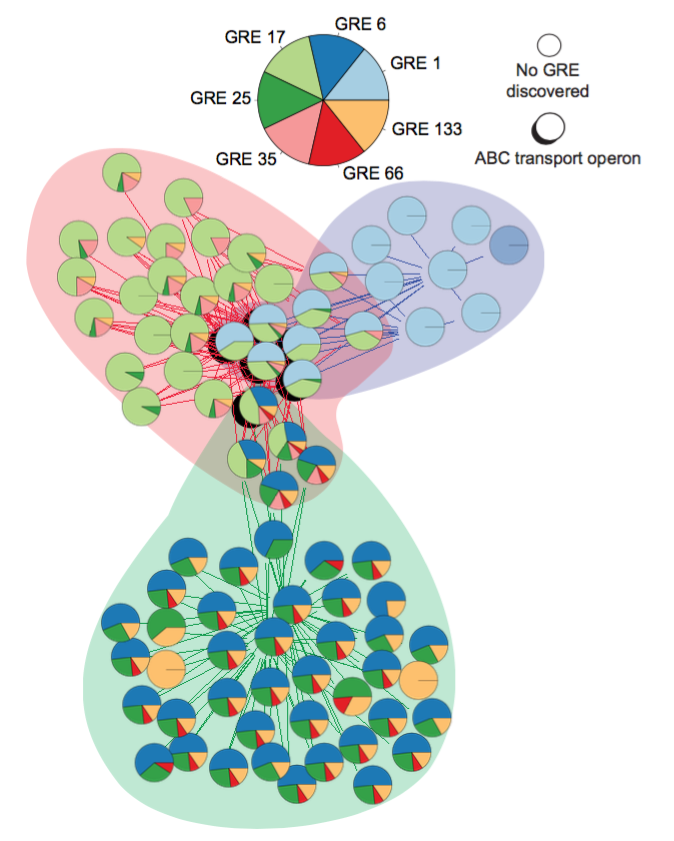
Brooks and Reiss et al (2014). A system‐level model for the microbial regulatory genome
Clustering for Data Integration
Similarities between 4567 human genes
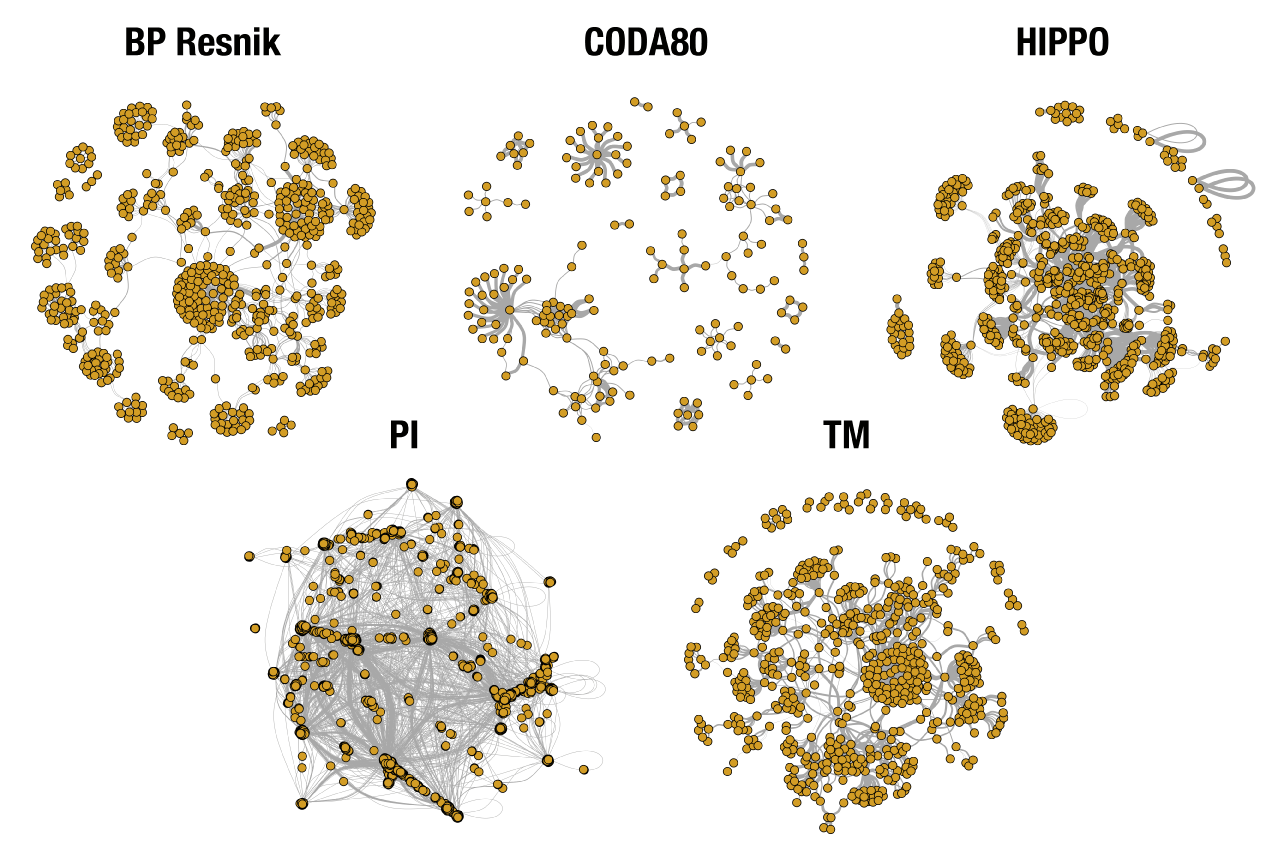
Selected from their relationship to 120 genes involved in mitosis, DNA mismatch repair, and BMP signaling
Combined Kernel Network
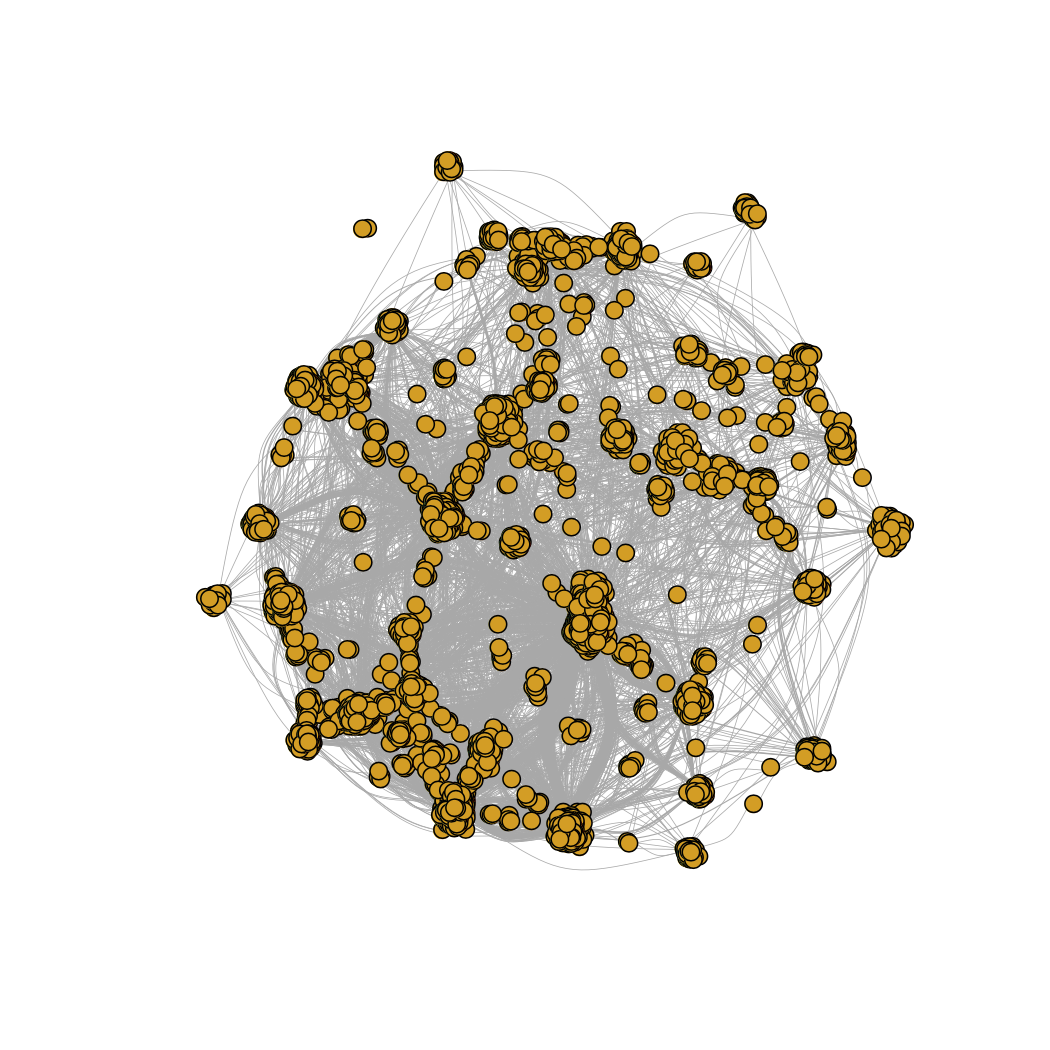
For more info: Practical 1
How to detect community structure?
- Node-based spectral clustering
- Edge-based link-community clustering